
Office IQ: Ranking Which Empty Building Would Lift a Neighborhood Most
How I mapped every parcel in Kern County as one connected system to test a simple idea: that vacancy spreads, and that filling the right vacant building can reverse it.
At a glance
Office IQ is a research prototype I built for my own coworking business in downtown Bakersfield. Every downtown has empty storefronts and offices. Brokers can tell you what a building is worth. Nobody could tell me which vacant building, once filled, would do the most for the buildings around it, and I wanted to see if data could answer that.
- Project
- Office IQ, a research prototype for downtown commercial real estate
- Question
- Which vacant commercial building would lift its neighbors most if it were activated?
- Scale
- 421,684 parcels and more than 30 million connections between them
- Build
- Public county data, a decade of aerial imagery, a graph model, and a map interface
- Status
- Paused while I wait on additional parcel data
Why one vacant building matters
Anyone who walks a downtown corridor knows the feeling. One dark storefront makes the next one look riskier. One busy coffee shop makes the block feel alive. If that effect exists, it should be measurable, and the empty buildings with the biggest ripple effect are the ones a city, an owner, or an investor should fill first.
In a market like Bakersfield, nobody scores that ripple effect. Commercial real estate tools are built for big cities, and they score buildings one at a time, so a building’s value to its neighbors never shows up.
How Office IQ scores a vacant building
I planned Office IQ as 12 sprints across four phases, each phase with a written gate it had to pass before the next one started. The build ran through five AI roles, each with a written charter: a data engineer, a machine learning engineer, a backend developer, a frontend developer, and a product and quality reviewer. I directed the sprints, held the gates, and did the work only a local could do, like labeling which buildings were occupied.
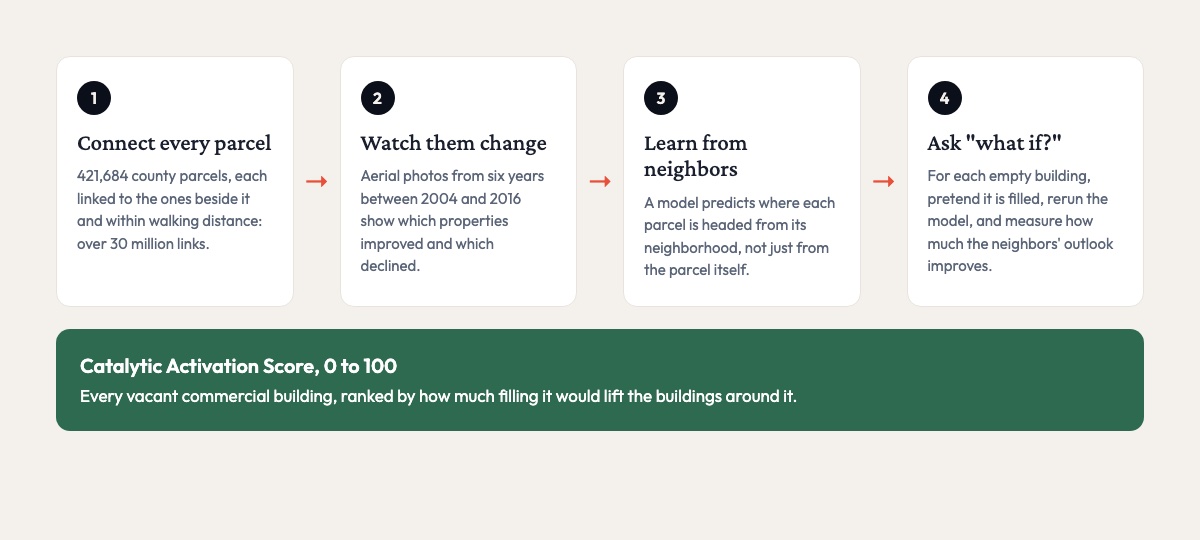
Public county records became a map of 421,684 parcels. Each parcel links to the ones it shares a boundary with and the ones within walking distance, more than 30 million links in all. For downtown parcels, the system also pulled aerial images from six different years between 2004 and 2016, 12,739 images in all, so it could see which properties were improving and which were declining over time.
The core model predicts where a parcel is headed using its neighborhood along with the parcel itself. If that beats a model that looks at each parcel alone, the ripple effect is measurable. On top of the model sits a “what if” engine. For each vacant building, the system pretends it has been filled, reruns the model, and measures how much its neighbors’ outlook improves. That change becomes the building’s Catalytic Activation Score, from 0 to 100.
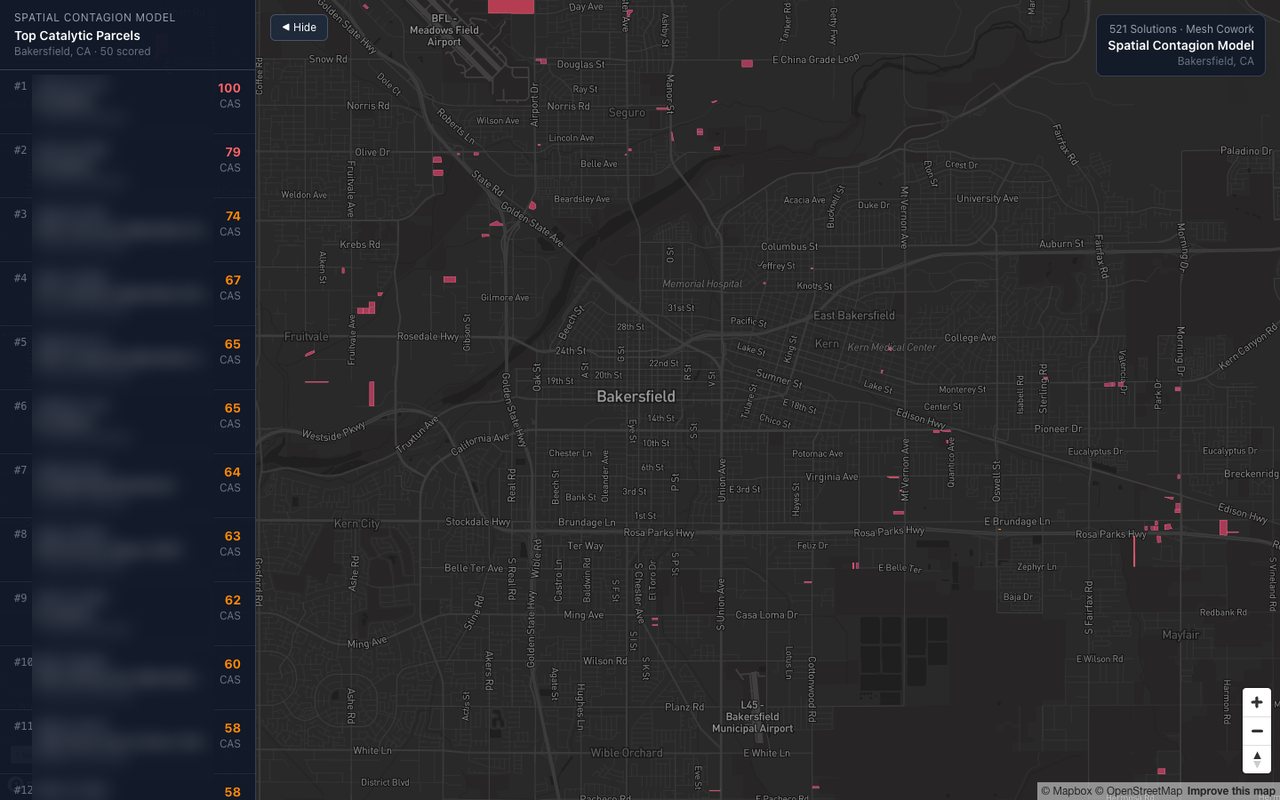
A web interface shows the scored parcels on a map, with a ranked list and a card for each property.
Getting the data right first
Most of the value in a project like this is in data you can trust. Before I trained any model, a quality review checked the full parcel dataset.
| Check | Result |
|---|---|
| Parcels loaded | 421,684 |
| Difference from an independent county source | 0% |
| Invalid parcel shapes | 0 |
| Missing, malformed, or duplicate parcel IDs | 0 |
| Connections between parcels | 30,493,078 |
The review wrote down every gap it found. One type of street connection was too slow to compute and got deferred. Two planning layers overwrote each other on import. A city data source returned the wrong region and was skipped. The review also caught a quieter trap. The county’s public map services silently skip records if you download them page by page the usual way, so every download was built to use a method that cannot skip.
How the testing was set up
A model that predicts neighborhoods can fool you easily. If a parcel’s next-door neighbor is in the training data, the model can look accurate just by memorizing the block, so I built the testing to prevent that.
I grouped parcels into half-kilometer squares and held out entire squares for testing, so the model never saw a test parcel’s neighbors in training. I set the downtown Chester Avenue corridor aside completely and never used it in training, as a final test on the area that matters most. And the plan required the models to clear a set accuracy bar, and the rankings to match past activations, before anything was built on top of them.
The first models did not clear that bar, and I recorded that as a miss. Until the models clear it, the rankings are a research result and shouldn’t be used to decide where to invest.
Where the vacant building research stands
Office IQ is paused. I built the data pipeline, the models, the “what if” engine, and the map interface, and the pipeline ran end to end. The models need more information about each property, such as ownership and assessed value, and that dataset has not arrived yet. When it does, the work picks up at the gate it did not pass.
What I’d take from it
If you’re thinking about putting a model on your own data, spend the early effort on the data and write down every gap you find, because a clean dataset will carry a plain model further than the reverse. Test the model on cases it has never seen, the way it will be used. And decide what “good enough” means before the numbers come in, so a short result gets recorded as short.
Have a question your data should be able to answer?
I build data and AI systems for small businesses and local organizations, from cleaning up the data you already have to building models that answer a specific question. The testing is set up before the results come in, and you get a clear record of what the model can and cannot tell you. If you have data you think could be telling you more, let’s talk.